
West Des Moines, Iowa Hail Report and Map: July 2, 2026
Was there hail in West Des Moines, IA on July 2, 2026? Radar estimated hail up to 1.6 inches inside the town limits of West Des Moines on July 2, 2026 (Eastern time). Radar estimates of at least 0.5 inch covered 51% of the town. Across the report area, the maximum radar estimate was 2.17 inches. The strongest part of the swath was about 104 miles northeast of Des Moines, IA. Radar detected hail aloft in this area between about 6:50 a.m. and 8:10 p.m. CT on July 2, 2026.
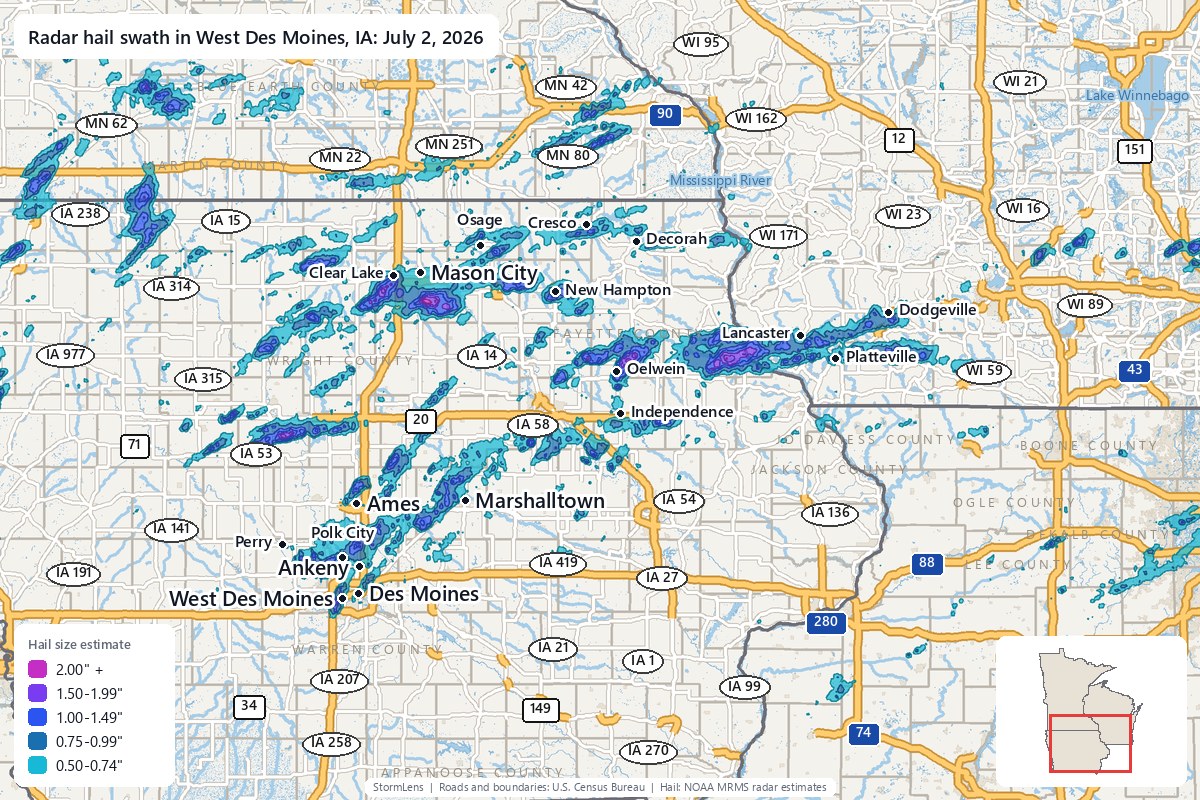
Download the free app to view this hail swath and search an address.
Hail estimates at a glance
| Storm date (Eastern time) | July 2, 2026 (Thursday) |
|---|---|
| Maximum radar estimate across the area | 2.17 inches; strongest part of the swath about 104 miles northeast of Des Moines, IA |
| Maximum radar estimate inside West Des Moines | 1.6 inches |
| Share of West Des Moines with radar estimates of at least 0.5 inch | 51% |
| Approximate radar timing | Between about 6:50 a.m. and 8:10 p.m. CT on July 2, 2026 (Central time) |
| County coverage includes (0.5 inch or larger) | Cerro Gordo County (361 sq mi), Clayton County (352 sq mi), Grant County (320 sq mi), Polk County (251 sq mi), Fayette County (225 sq mi) and Story County (223 sq mi) |
| Area with radar estimates of 0.5 inch or larger | about 4,482 square miles |
| Area with radar estimates of 1 inch or larger | about 692 square miles |
| Source | NOAA MRMS radar hail estimates (MESH) |
Which towns had hail on July 2, 2026?
Radar estimated hail of at least 0.5 inch inside these town limits, using U.S. Census boundaries. Each percentage is the share of town area with those estimates.
| Town | County | Maximum radar estimate inside town limits | Town area with estimates of at least 0.5 inch |
|---|---|---|---|
| Guttenberg, IA | Clayton County | 1.67 inches | 100% |
| West Des Moines, IA | Polk County | 1.6 inches | 51% |
| Clear Lake, IA | Cerro Gordo County | 1.51 inches | 99% |
| New Hampton, IA | Chickasaw County | 1.38 inches | 100% |
| Hazleton, IA | Buchanan County | 1.33 inches | 31% |
| Granger, IA | Dallas County | 1.29 inches | 100% |
| Oelwein, IA | Fayette County | 1.28 inches | 97% |
| Garnavillo, IA | Clayton County | 1.26 inches | 100% |
| Rhodes, IA | 1.22 inches | 100% | |
| Huxley, IA | Story County | 1.19 inches | 100% |
| Linden, WI | Iowa County | 1.18 inches | 100% |
| Charles City, IA | Floyd County | 1.14 inches | 26% |
| Urbandale, IA | Polk County | 1.12 inches | 25% |
| Clive, IA | Polk County | 1.12 inches | 28% |
| Windsor Heights, IA | Polk County | 1.12 inches | 100% |
| Johnston, IA | Polk County | 1.1 inches | 44% |
| Rockwell, IA | Cerro Gordo County | 1.07 inches | 100% |
| Cambridge, IA | Story County | 1.07 inches | 100% |
| Gilbert, IA | Story County | 1.06 inches | 88% |
| Cassville, WI | Grant County | 1.06 inches | 100% |
| Polk City, IA | Polk County | 1.05 inches | 100% |
| Elkport, IA | 1.03 inches | 100% | |
| Ames, IA | Story County | 0.96 inch | 15% |
| Cresco, IA | Howard County | 0.96 inch | 83% |
| Ankeny, IA | Polk County | 0.94 inch | 46% |
| Decorah, IA | Winneshiek County | 0.93 inch | 15% |
| Ventura, IA | Cerro Gordo County | 0.91 inch | 73% |
| Marshalltown, IA | Marshall County | 0.89 inch | 3% |
| Quasqueton, IA | Buchanan County | 0.88 inch | 100% |
| Grimes, IA | Polk County | 0.87 inch | 21% |
| Rewey, WI | 0.86 inch | 100% | |
| Des Moines, IA | Polk County | 0.85 inch | 19% |
| Platteville, WI | Grant County | 0.83 inch | 43% |
| Altoona, IA | Polk County | 0.82 inch | 26% |
| Elkader, IA | Clayton County | 0.81 inch | 41% |
| Conrad, IA | Grundy County | 0.81 inch | 82% |
| Kanawha, IA | Hancock County | 0.81 inch | 61% |
| State Center, IA | Marshall County | 0.8 inch | 94% |
| Fayette, IA | Fayette County | 0.79 inch | 100% |
| Mason City, IA | Cerro Gordo County | 0.76 inch | 91% |
How big was the hail in West Des Moines?
Radar estimated hail up to 1.6 inches inside the town limits of West Des Moines. Among the listed towns, the highest estimate was 1.67 inches inside the limits of Guttenberg. The maximum estimates in Des Moines, Ames and Ankeny were 0.96 inch or less. A town's maximum isn't an estimate for every home. Check the swath for estimates around an address.
What time did radar detect hail?
Radar detected hail aloft in this area between about 6:50 a.m. and 8:10 p.m. CT on July 2, 2026. We used 629 NOAA radar hail detections in this area to estimate the window. We trim outlying detection times when enough are available, then round down to five-minute marks. It doesn't give an arrival time at an address.
This report shares at least one town with the report for July 1, 2026. Storm dates run from midnight to midnight Eastern time, so a late-evening storm farther west can appear under two dates. See the Sheboygan, WI report for July 1, 2026.
Data source and limits
We use NOAA's MRMS radar product MESH (Maximum Estimated Size of Hail) for hail-size estimates. Each town's figure is the maximum inside its Census town limits. The percentage is the town area with estimates of at least 0.5 inch. A town's maximum isn't an estimate for every home. Each storm date covers one calendar day in Eastern time. A late-evening storm west of the Eastern time zone can appear under two dates. Radar estimates don't confirm hail on the ground or roof damage. Hail of 0.5 to 0.75 inch can damage roofs, especially older roofs. An estimate below 1 inch doesn't rule out damage. Read how we calculate sizes and times.
Other hail reports for July 2, 2026
- Hail in Aurora, IL: up to 1.19 inches
- Hail in Clarksville, TN: up to 2.16 inches
- Hail in Huron, SD: up to 2.79 inches
- Hail in Greeley, CO: up to 1.77 inches
- Hail in Greenville, SC: up to 1.48 inches
- Hail in Nolensville, TN: up to 1.51 inches
- Hail in Fremont, NE: up to 1.66 inches
- Hail in Sioux City, IA: up to 1.79 inches
- Hail in Fort Myers, FL: up to 1.25 inches
- Hail in Germantown, WI: up to 1.39 inches
- Hail in Gadsden, AL: up to 1.98 inches
- Hail in Fairview, TN: up to 1.38 inches
- Hail near Dalton, GA: up to 1.48 inches