
St. Louis, Missouri Hail Report and Map: July 4, 2026
Was there hail in St. Louis, MO on July 4, 2026? Radar estimated hail up to 0.87 inch inside the town limits of St. Louis on July 4, 2026 (Eastern time). Radar estimates of at least 0.5 inch covered 23% of the town. Across the report area, the maximum radar estimate was 1.05 inches. The strongest part of the swath was about 5 miles northwest of St. Louis, MO. Radar detected hail aloft in this area between about 11:55 a.m. and 3:25 p.m. CT on July 4, 2026.
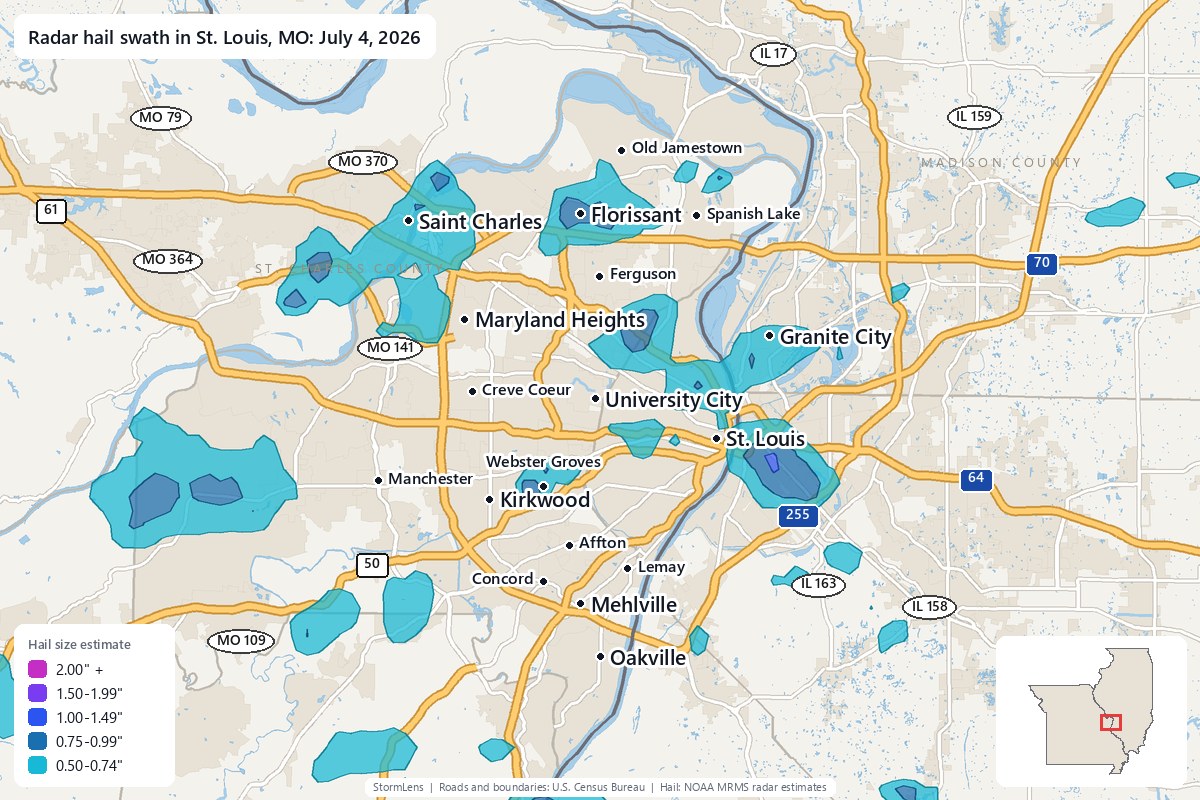
Download the free app to view this hail swath and search an address.
Hail estimates at a glance
| Storm date (Eastern time) | July 4, 2026 (Saturday) |
|---|---|
| Maximum radar estimate across the area | 1.05 inches; strongest part of the swath about 5 miles northwest of St. Louis, MO |
| Maximum radar estimate inside St. Louis | 0.87 inch |
| Share of St. Louis with radar estimates of at least 0.5 inch | 23% |
| Approximate radar timing | Between about 11:55 a.m. and 3:25 p.m. CT on July 4, 2026 (Central time) |
| County coverage includes (0.5 inch or larger) | St. Louis County (48 sq mi), St. Clair County (24 sq mi), St. Charles County (20 sq mi), St. Louis city (15 sq mi) and Madison County (12 sq mi) |
| Area with radar estimates of 0.5 inch or larger | about 117 square miles |
| Source | NOAA MRMS radar hail estimates (MESH) |
Which towns had hail on July 4, 2026?
Radar estimated hail of at least 0.5 inch inside these town limits, using U.S. Census boundaries. Each percentage is the share of town area with those estimates.
| Town | County | Maximum radar estimate inside town limits | Town area with estimates of at least 0.5 inch |
|---|---|---|---|
| East St. Louis, IL | 1.05 inches | 75% | |
| Florissant, MO | Saint Louis County | 0.99 inch | 61% |
| Webster Groves, MO | Saint Louis County | 0.99 inch | 43% |
| Jennings, MO | Saint Louis County | 0.94 inch | 78% |
| Flordell Hills, MO | Saint Louis County | 0.94 inch | 100% |
| St. Peters, MO | 0.93 inch | 14% | |
| Cahokia Heights, IL | 0.93 inch | 13% | |
| St. Louis, MO | City of Saint Louis | 0.87 inch | 23% |
| Pine Lawn, MO | Saint Louis County | 0.87 inch | 97% |
| Hazelwood, MO | Saint Louis County | 0.83 inch | 19% |
| Rock Hill, MO | Saint Louis County | 0.82 inch | 44% |
| St. Charles, MO | 0.82 inch | 35% | |
| Brentwood, MO | Saint Louis County | 0.8 inch | 33% |
| West Alton, MO | Saint Charles County | 0.8 inch | 3% |
| Granite City, IL | Madison County | 0.77 inch | 28% |
| Bridgeton, MO | Saint Louis County | 0.77 inch | 50% |
| Northwoods, MO | Saint Louis County | 0.77 inch | 100% |
| Madison, IL | Madison County | 0.77 inch | 16% |
| Maplewood, MO | Saint Louis County | 0.75 inch | 45% |
How big was the hail in St. Louis?
Radar estimated hail up to 0.87 inch inside the town limits of St. Louis. Among the listed towns, the highest estimate was 1.05 inches inside the limits of East St. Louis. A town's maximum isn't an estimate for every home. Check the swath for estimates around an address.
Towns near the hail
The strongest part of the swath was within 15 miles of these towns. Distances and directions run from each town to that part of the swath.
- University City, MO: strongest radar estimates about 3 miles northeast of town
- East Saint Louis, IL: strongest radar estimates about 7 miles northwest of town
- Ferguson, MO: strongest radar estimates about 5 miles southeast of town
- Overland, MO: strongest radar estimates about 5 miles east of town
- Clayton, MO: strongest radar estimates about 4 miles northeast of town
- Saint Ann, MO: strongest radar estimates about 7 miles southeast of town
- Bellefontaine Neighbors, MO: strongest radar estimates about 5 miles southwest of town
- Saint Charles, MO: strongest radar estimates about 14 miles southeast of town
What time did radar detect hail?
Radar detected hail aloft in this area between about 11:55 a.m. and 3:25 p.m. CT on July 4, 2026. We used 57 NOAA radar hail detections in this area to estimate the window. We trim outlying detection times when enough are available, then round down to five-minute marks. It doesn't give an arrival time at an address.
Data source and limits
We use NOAA's MRMS radar product MESH (Maximum Estimated Size of Hail) for hail-size estimates. Each town's figure is the maximum inside its Census town limits. The percentage is the town area with estimates of at least 0.5 inch. A town's maximum isn't an estimate for every home. Each storm date covers one calendar day in Eastern time. A late-evening storm west of the Eastern time zone can appear under two dates. Radar estimates don't confirm hail on the ground or roof damage. Hail of 0.5 to 0.75 inch can damage roofs, especially older roofs. An estimate below 1 inch doesn't rule out damage. Read how we calculate sizes and times.
Other hail reports for July 4, 2026
- Hail in Oklahoma City, OK: up to 3.44 inches
- Hail in Bristol, CT: up to 2.78 inches
- Hail in Des Moines, IA: up to 1.37 inches
- Hail in Severn, MD: up to 1.4 inches
- Hail in Lincoln, NE: up to 1.91 inches
- Hail in Borger, TX: up to 2.76 inches
- Hail in Woodward, OK: up to 3.89 inches
- Hail in Davenport, IA: up to 1.51 inches
- Hail in Lancaster, PA: up to 1.46 inches
- Hail in Memphis, TN: up to 1.3 inches
- Hail in Huntley, IL: up to 1.78 inches
- Hail in Gaithersburg, MD: up to 1.52 inches
- Hail in Peachtree Corners, GA: up to 1.11 inches
- Hail in Newton, IA: up to 1.13 inches
- Hail in Little Rock, AR: up to 1.46 inches
- Hail near Poughkeepsie, NY: up to 1.89 inches
- Hail in Blacksburg, VA: up to 2.54 inches
- Hail in Sauk Centre, MN: up to 2.64 inches
- Hail in Pine Bluff, AR: up to 1.31 inches
- Hail in Taneytown, MD: up to 2.38 inches
- Hail in Charlottesville, VA: up to 1.33 inches
- Hail near Saint Cloud, MN: up to 1.35 inches
- Hail in North Little Rock, AR: up to 1.54 inches
- Hail in Lynchburg, VA: up to 1.53 inches
- Hail near Richmond, VA: up to 1.47 inches
- Hail in Spotsylvania Courthouse, VA: up to 1.98 inches
- Hail near Sioux Falls, SD: up to 1.72 inches
- Hail near Aurora, IL: up to 1.89 inches
- Hail near Niagara Falls, NY: up to 2.11 inches